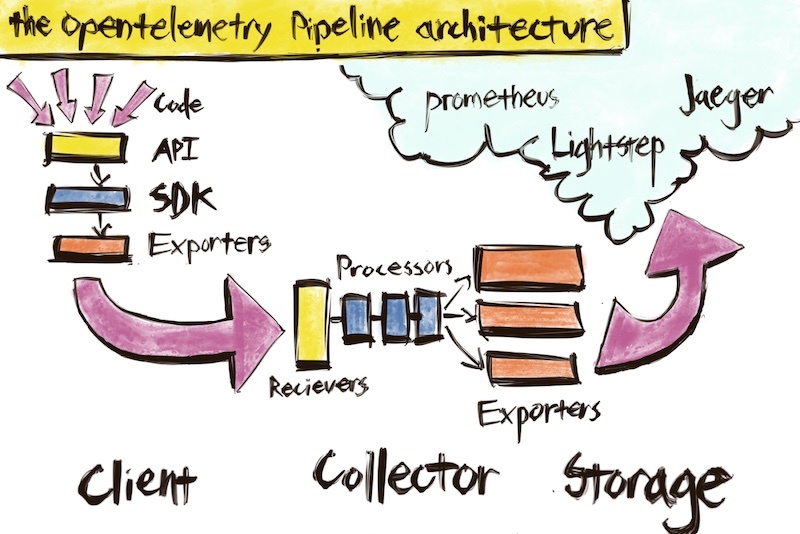
OpenTelemetry
The concept of Distributed Tracing was first proposed by Google. The technology has matured over time, and there are now some protocol standards available for reference. Currently, two open-source frameworks are quite influential in this area: Netflix's OpenTracing and Google's OpenCensus. Both frameworks have a sizable developer community. To establish a unified technical standard, the two frameworks merged to form the OpenTelemetry project, abbreviated as otel. For more details, you can refer to:
Thus, our tracing technology solution is implemented based on the OpenTelemetry standard, with some open-source projects implementing the protocol standard in Golang:
- https://github.com/open-telemetry/opentelemetry-go
- https://github.com/open-telemetry/opentelemetry-go-contrib
Other third-party frameworks and systems (such as Jaeger/Prometheus/Grafana) also adhere to standardized protocols to integrate with OpenTelemetry, significantly reducing development and maintenance costs.

Key Concepts
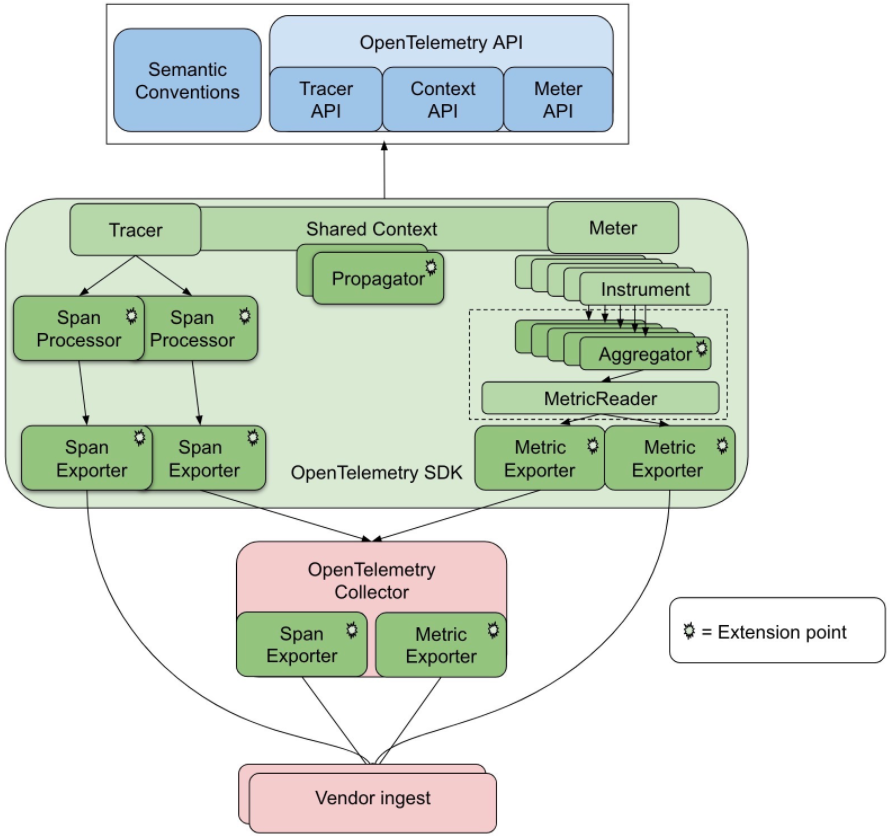
Let's first look at the architecture diagram of OpenTelemetry.
We won't introduce it in full, only the commonly used concepts. For an introduction to the internal technical architecture of OpenTelemetry,
you can refer to OpenTelemetry Architecture,
and for semantic conventions, please refer to: https://github.com/open-telemetry/opentelemetry-specification/blob/main/specification/trace/api.md

TracerProvider
Mainly responsible for creating Tracer, usually requiring a concrete implementation from a third-party distributed tracing management platform. By default, it is an empty TracerProvider (NoopTracerProvider). While it can create Tracer, it doesn’t actually execute specific data flow transmission logic internally.
Tracer
Tracer represents a complete tracing, consisting of one or more span. The example below illustrates a tracer consisting of 8 spans:
        [Span A]  ←←←(the root span)
            |
     +------+------+
     |             |
 [Span B]      [Span C] ←←←(Span C is a `ChildOf` Span A)
     |             |
 [Span D]      +---+-------+
               |           |
           [Span E]    [Span F] >>> [Span G] >>> [Span H]
                                       ↑
                                       ↑
                                       ↑
                         (Span G `FollowsFrom` Span F)
The timeline representation makes it easier to understand:
––|–––––––|–––––––|–––––––|–––––––|–––––––|–––––––|–––––––|–> time

 [Span A···················································]
   [Span B··············································]
      [Span D··········································]
    [Span C········································]
         [Span E·······]        [Span F··] [Span G··] [Span H··]
We usually create a Tracer in the following way:
gtrace.NewTracer(tracerName)
Span
A Span is a fundamental component of a tracing. It represents a single work unit, such as a function call or an HTTP request. A span records the following essential elements:
- Service name (
operation name) - Service start and end times
K/VformTagsK/VformLogsSpanContext
Span is the most frequently used object among them, thus creating a Span is very straightforward, for example:
gtrace.NewSpan(ctx, spanName, opts...)
Attributes
Attributes are stored as K/V key-value pairs for user-defined tags, mainly used for query filtering of tracing results. For example: http.method="GET",http.status_code=200. The key must be a string, and the value must be a string, boolean, or numeric type. Attributes in a span are only visible to itself and are not passed to subsequent spans through SpanContext. The way to set Attributes is as follows:
span.SetAttributes(
    label.String("http.remote", conn.RemoteAddr().String()),
    label.String("http.local", conn.LocalAddr().String()),
)
Events
Events are similar to Attributes and are also in the form of K/V key-value pairs. Unlike Attributes, Events also record the time when they are written, so Events are mainly used to record the time certain events occur. The key for Events must also be a string, but there are no restrictions on the type of value. For example:
span.AddEvent("http.request", trace.WithAttributes(
    label.Any("http.request.header", headers),
    label.Any("http.request.baggage", gtrace.GetBaggageMap(ctx)),
    label.String("http.request.body", bodyContent),
))
SpanContext
SpanContext carries some data used for cross-service (cross-process) communication, mainly including:
-
Information sufficient to identify this span within the system, e.g.,
span_id, trace_id. -
Baggage- maintains user-definedK/Vformatted data for cross-service (cross-process) tracing in the entire tracing link.Baggageis similar toAttributes, also inK/Vkey-value pair format. The differences are: -
Both
keyandvaluecan only be in string format. -
Baggageis visible not only to the current span but is also passed to all subsequent child spans throughSpanContext. Be cautious usingBaggagebecause transmitting theseK,Vin all spans incurs non-trivial network and CPU overhead.
Propagator
The Propagator is used for encoding/decoding data end-to-end, such as data transmission from the Client to the Server. TraceId, SpanId, and Baggage also need to be managed for data transmission through the propagator. Business-end developers are usually not aware of the Propagator, only middleware/interceptor developers need to understand its role. The standard protocol implementation library of OpenTelemetry provides a commonly used TextMapPropagator for common text data end-to-end transmission. Furthermore, to ensure compatibility of the data transmitted in the TextMapPropagator, special characters should not be included. For details, please refer to: https://github.com/open-telemetry/opentelemetry-specification/blob/main/specification/context/api-propagators.md
The GoFrame framework uses the following propagator objects through the gtrace module and sets them globally in OpenTelemetry:
// defaultTextMapPropagator is the default propagator for context propagation between peers.
defaultTextMapPropagator = propagation.NewCompositeTextMapPropagator(
    propagation.TraceContext{},
    propagation.Baggage{},
)
Supported Components
The core components of GoFrame have fully supported the OpenTelemetry standard and automatically enable the tracing feature, with no need for developers to explicitly call or use it. Without injecting an external TracerProvider, the framework will use the default TracerProvider, which will only automatically create a TraceID and SpanID to facilitate tracing the request log and will not execute complex logic.
Including but not limited to the following core components:
| Components with Auto Tracing Support | Component Name | Description |
|---|---|---|
HTTP Client | gclient | The HTTP client automatically enables the tracing feature. For specific usage examples, please refer to the subsequent example chapter. |
Http Server | ghttp | The HTTP server automatically enables the tracing feature. For specific usage examples, please refer to the subsequent example chapter. |
gRPC Client | contrib/rpc/grpcx | The gRPC client automatically enables the tracing feature. For specific usage examples, please refer to the subsequent example chapter. |
gRPC Server | contrib/rpc/grpcx | The gRPC server automatically enables the tracing feature. For specific usage examples, please refer to the subsequent example chapter. |
Logging | glog | The log content needs to inject the current request's TraceId to quickly locate issues through logs. This feature is implemented by the glog component. Developers need to call the Ctx chain operation method to pass the context.Context context variable to the current logging operation chain when outputting logs. Failing to pass the context.Context will result in losing the TraceId in the log content. |
ORM | gdb | The execution of the database is an essential part of the link. The Orm component needs to deliver its execution information into the tracing as part of the execution trace. |
NoSQL Redis | gredis | The execution of Redis is also an essential part of the tracing. Redis needs to deliver its execution information into the tracing as part of the execution trace. |
Utils | gtrace | Managing the Tracing feature requires some encapsulation, mainly considering extensibility and usability. This encapsulation is implemented by the gtrace module. The documentation can be found at: https://pkg.go.dev/github.com/gogf/gf/v2/net/gtrace |