Single Process Example
Single process tracing refers to the call chain relationship between methods within the process. This scenario does not involve distributed tracing, making it relatively simple. Let's use this example as our introductory case. Example code address: https://github.com/gogf/gf/tree/master/example/trace/inprocess
Root Span
root span is the first span object in the trace. In the single process scenario here, it often needs to be created manually. Subsequently, spans created within methods will act as its child spans.
In inter-service communication scenarios of distributed architectures, it is often unnecessary for developers to manually create a root span, as it is automatically created by interceptors of client/server requests.
Create a tracer and generate a root span:
func main() {
    const (
        serviceName = "otlp-http-client"
        endpoint    = "tracing-analysis-dc-hz.aliyuncs.com"
        path        = "adapt_******_******/api/otlp/traces"
    )

    var ctx = gctx.New()
    shutdown, err := otlphttp.Init(serviceName, endpoint, path)
    if err != nil {
        g.Log().Fatal(ctx, err)
    }
    defer shutdown()

    ctx, span := gtrace.NewSpan(ctx, "main")
    defer span.End()

    // Trace 1.
    user1 := GetUser(ctx, 1)
    g.Dump(user1)

    // Trace 2.
    user100 := GetUser(ctx, 100)
    g.Dump(user100)
}
The above code creates a root span and passes this span through context to the GetUser method, so that the trace chain can continue within the GetUser method.
Span Creation Between Methods
// GetUser retrieves and returns hard coded user data for demonstration.
func GetUser(ctx context.Context, id int) g.Map {
    ctx, span := gtrace.NewSpan(ctx, "GetUser")
    defer span.End()
    m := g.Map{}
    gutil.MapMerge(
        m,
        GetInfo(ctx, id),
        GetDetail(ctx, id),
        GetScores(ctx, id),
    )
    return m
}

// GetInfo retrieves and returns hard coded user info for demonstration.
func GetInfo(ctx context.Context, id int) g.Map {
    ctx, span := gtrace.NewSpan(ctx, "GetInfo")
    defer span.End()
    if id == 100 {
        return g.Map{
            "id":     100,
            "name":   "john",
            "gender": 1,
        }
    }
    return nil
}

// GetDetail retrieves and returns hard coded user detail for demonstration.
func GetDetail(ctx context.Context, id int) g.Map {
    ctx, span := gtrace.NewSpan(ctx, "GetDetail")
    defer span.End()
    if id == 100 {
        return g.Map{
            "site":  "https://goframe.org",
            "email": "john@goframe.org",
        }
    }
    return nil
}

// GetScores retrieves and returns hard coded user scores for demonstration.
func GetScores(ctx context.Context, id int) g.Map {
    ctx, span := gtrace.NewSpan(ctx, "GetScores")
    defer span.End()
    if id == 100 {
        return g.Map{
            "math":    100,
            "english": 60,
            "chinese": 50,
        }
    }
    return nil
}
This example code shows multi-level method trace information transmission, meaning that the ctx context variable is passed as the first parameter of the method. Within the method, we use fixed syntax to create/start a Span:
ctx, span := gtrace.NewSpan(ctx, "xxx")
defer span.End()
By calling span.End using defer, we end a Span, which records the lifecycle (start and end) information of the Span. This information will be displayed in the tracing system. For the second parameter spanName of the gtrace.NewSpan method, we directly give the method name so that it is more recognizable in the trace display.
Result Viewing
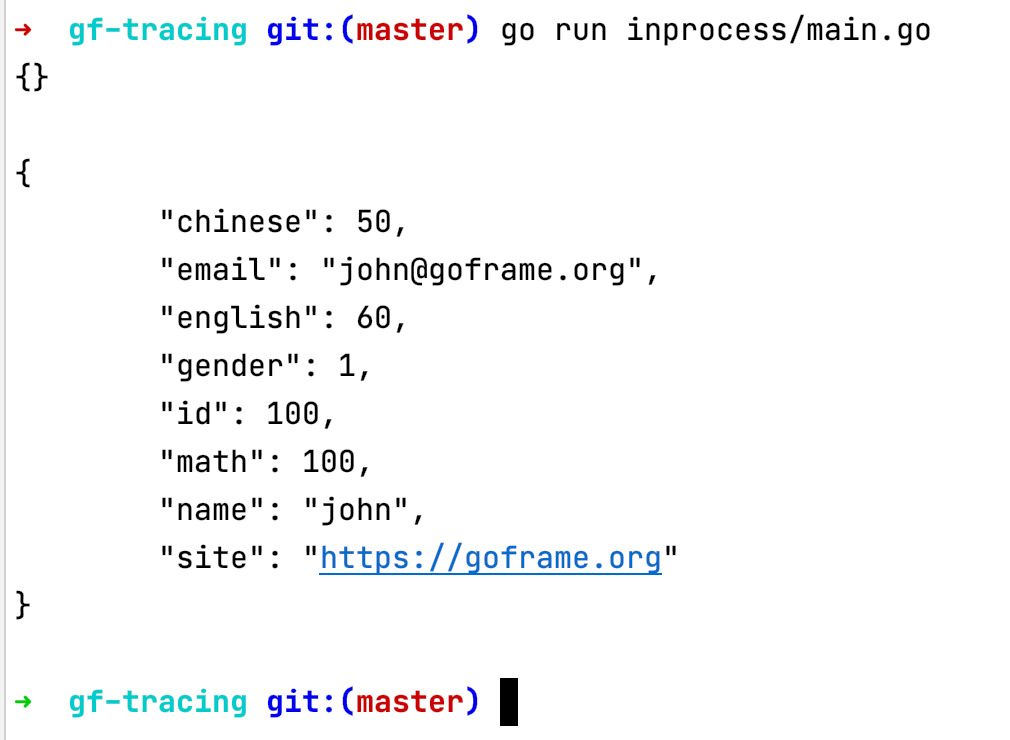
After executing the above program, the terminal outputs:

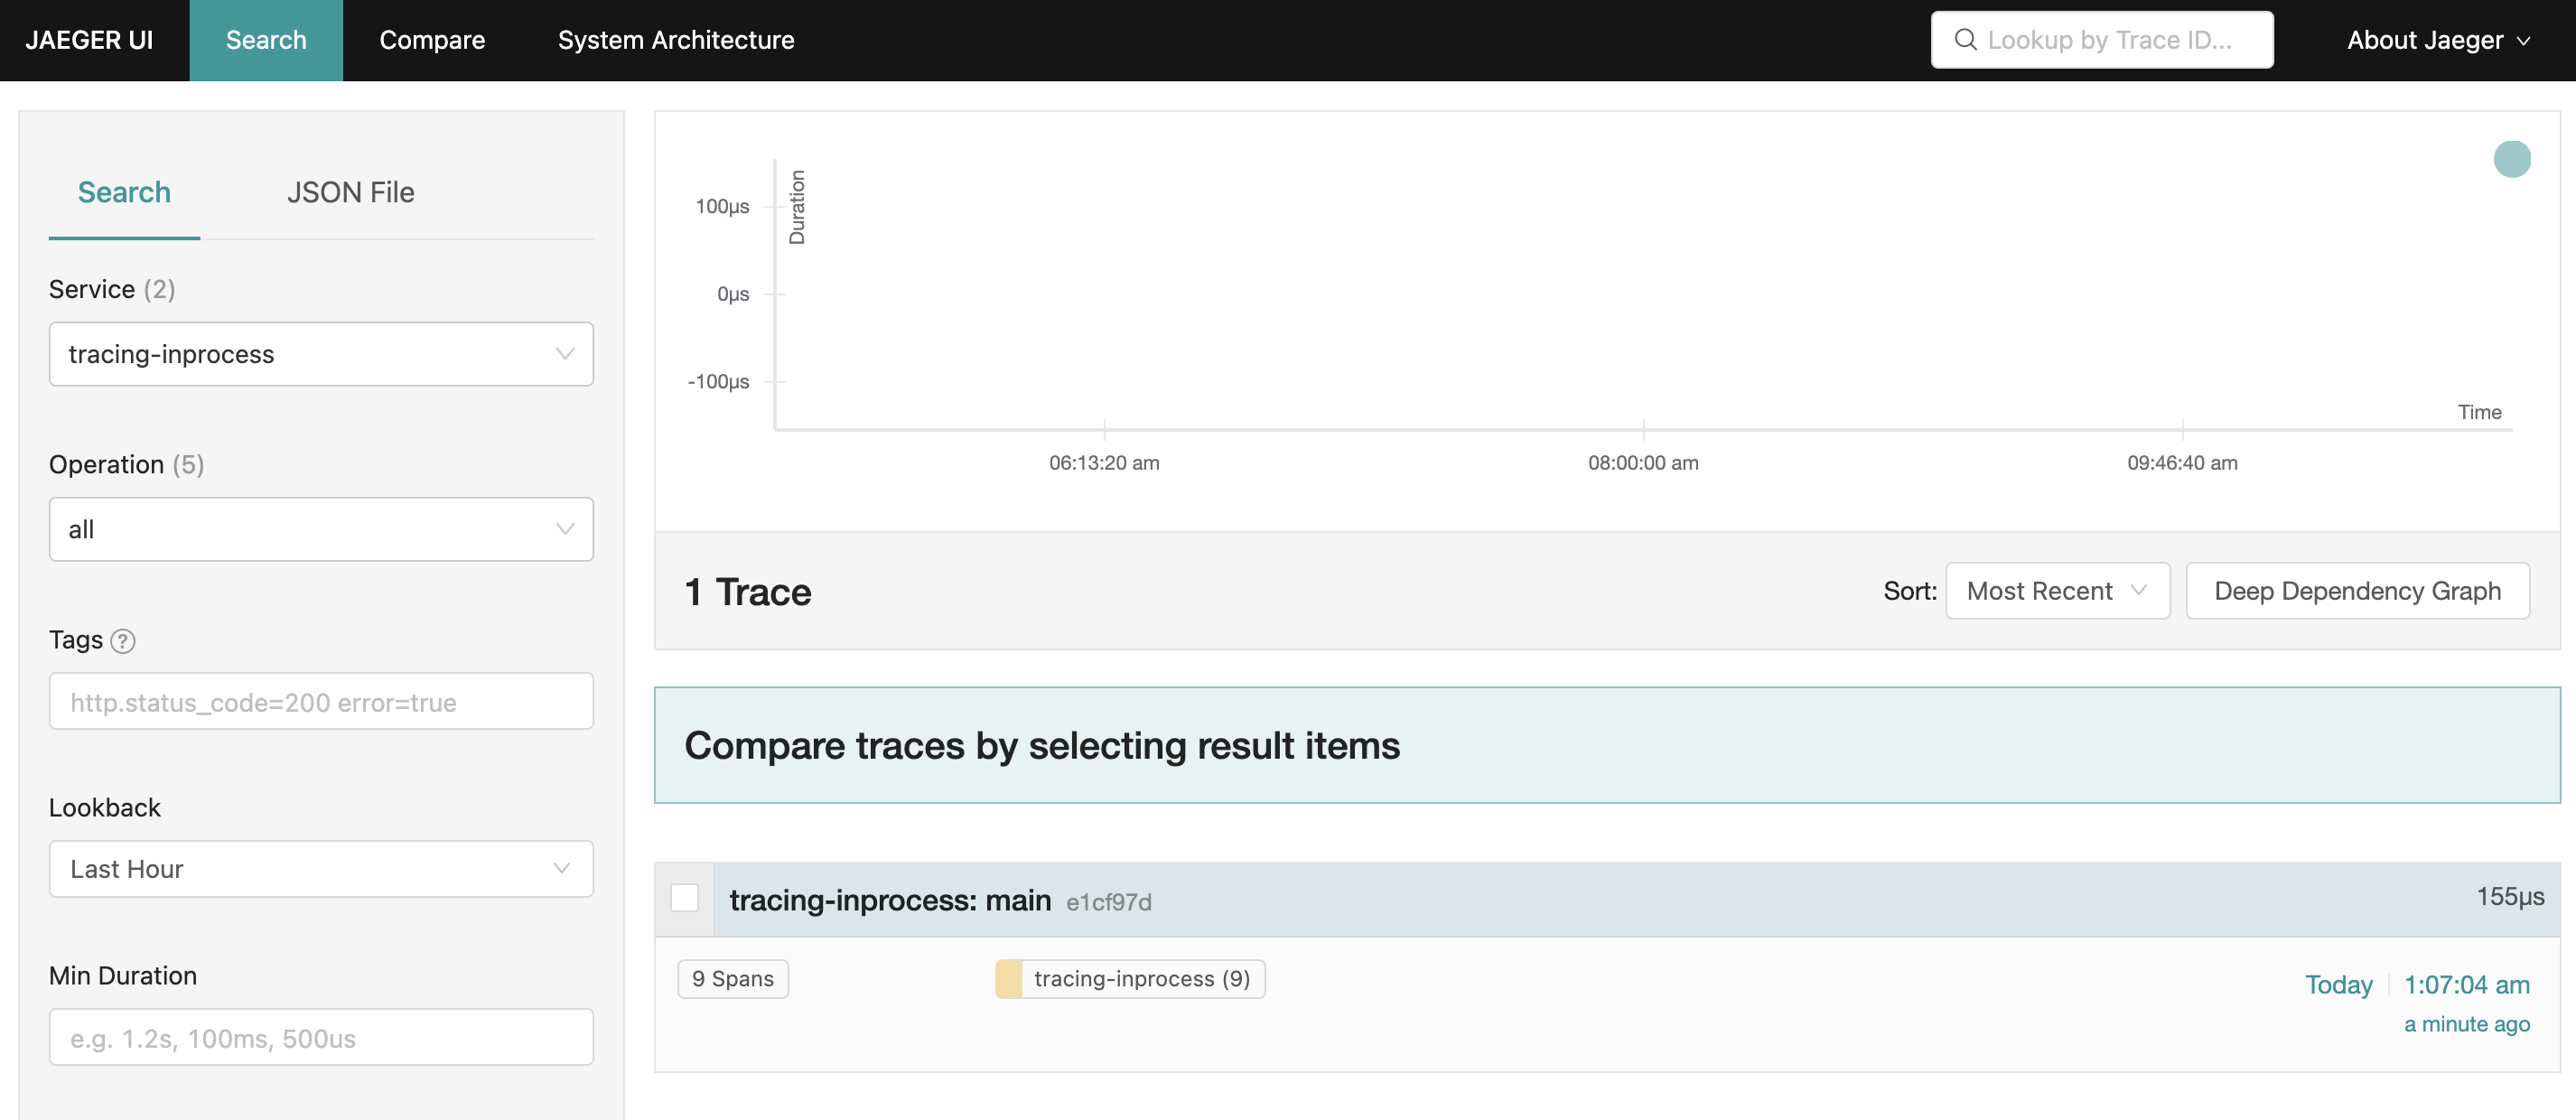
Open Jaeger UI: http://localhost:16686/search, and you can see the trace results: 

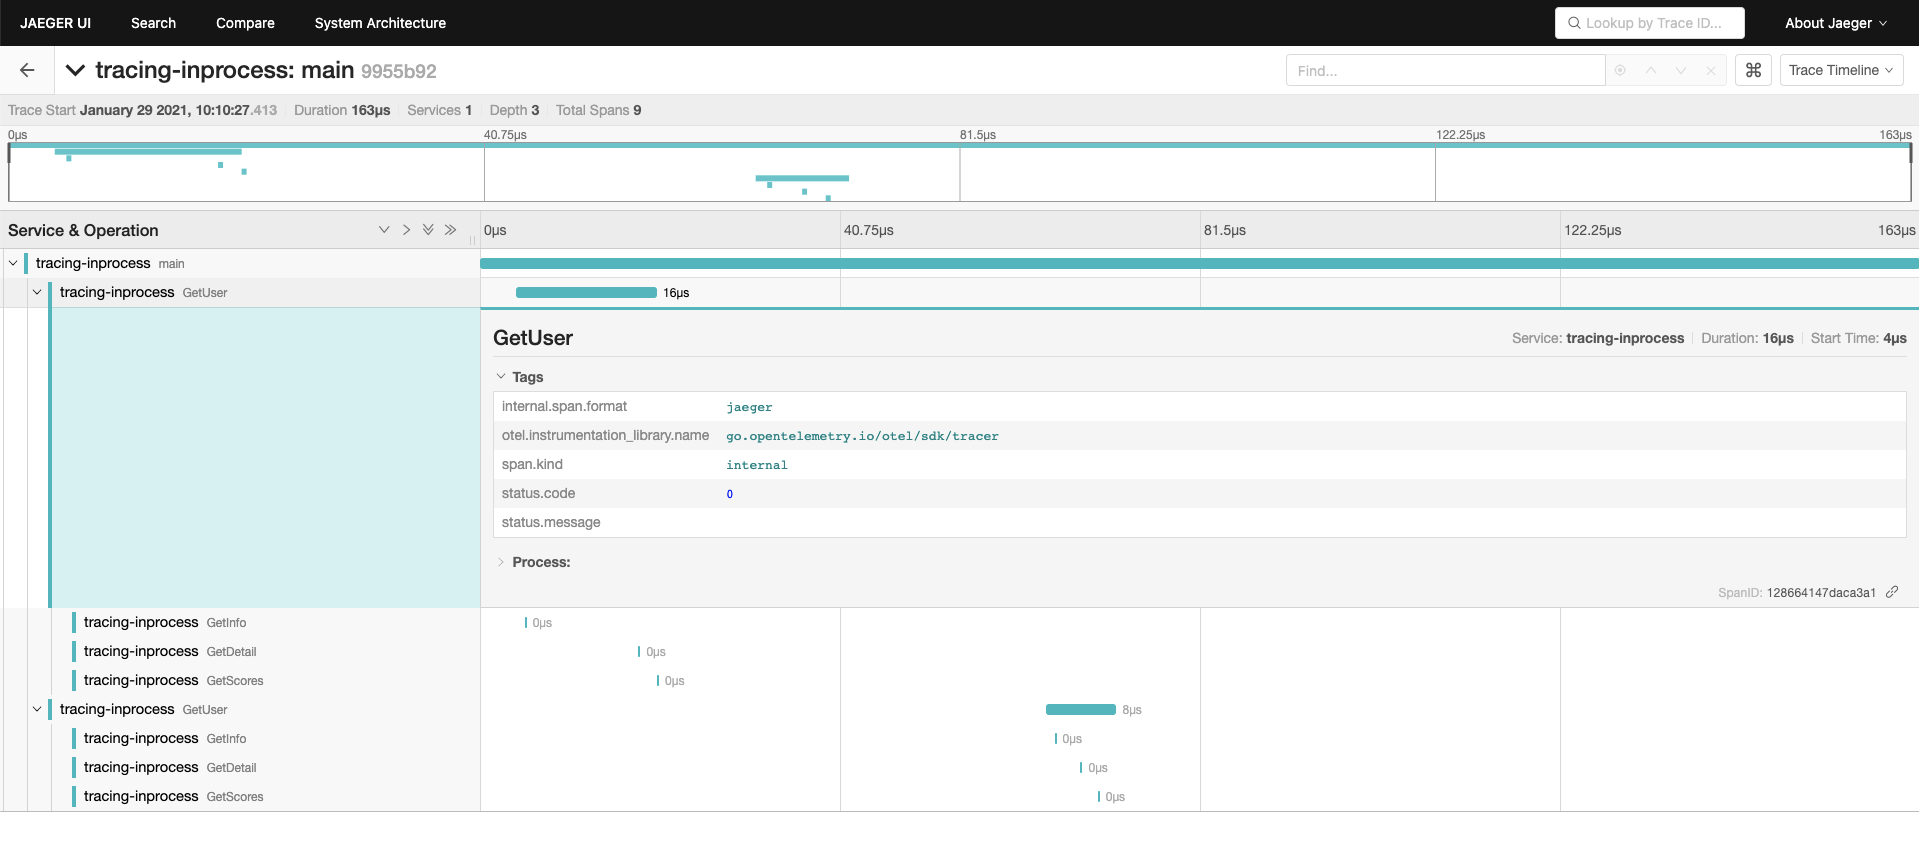
Clicking on the details allows you to view specific information, including the invocation order and relationship of spans, the execution timeline, and recorded Attributes and Events information, which significantly helps us locate system anomalies and identify performance bottlenecks.

The tracing-inprocess is the name of our tracer, which is usually the service name. Since we only have one process and one tracer, there is only one service name displayed here. The main is the name of the root span we created, and other spans were created based on this root span. Since we called the GetUser method twice in the program, it shows two calls to the GetUser method. Each GetUser call internally invokes the three methods GetInfo, GetDetail, and GetScores, and the hierarchical relationship of method calls is displayed very clearly, along with the duration of each method call.
The Tags and Process information recorded in each span corresponds to the Attributes and Events information in OpenTelemetry, which we will introduce in more detail in subsequent chapters.