Introduction
Synchronous Type is used to quickly expose monitoring metrics. Whether or not the metrics reader uses the monitoring metrics, the metric calculation results are completed and await reading. For example, total HTTP request count and request size must be recorded in the corresponding monitoring metrics during the request execution process, making them suitable for management as synchronous metrics.
The synchronous metrics provided by gmetric include: Counter, UpDownCounter, Histogram.
We will demonstrate the basic usage of synchronous metrics with a simple example.
package main

import (
    "go.opentelemetry.io/otel/exporters/prometheus"

    "github.com/gogf/gf/contrib/metric/otelmetric/v2"
    "github.com/gogf/gf/v2/frame/g"
    "github.com/gogf/gf/v2/os/gctx"
    "github.com/gogf/gf/v2/os/gmetric"
)

var (
    meter = gmetric.GetGlobalProvider().Meter(gmetric.MeterOption{
        Instrument:        "github.com/gogf/gf/example/metric/basic",
        InstrumentVersion: "v1.0",
    })
    counter = meter.MustCounter(
        "goframe.metric.demo.counter",
        gmetric.MetricOption{
            Help: "This is a simple demo for Counter usage",
            Unit: "bytes",
        },
    )
    upDownCounter = meter.MustUpDownCounter(
        "goframe.metric.demo.updown_counter",
        gmetric.MetricOption{
            Help: "This is a simple demo for UpDownCounter usage",
            Unit: "%",
        },
    )
    histogram = meter.MustHistogram(
        "goframe.metric.demo.histogram",
        gmetric.MetricOption{
            Help:    "This is a simple demo for histogram usage",
            Unit:    "ms",
            Buckets: []float64{0, 10, 20, 50, 100, 500, 1000, 2000, 5000, 10000},
        },
    )
)

func main() {
    var ctx = gctx.New()

    // Prometheus exporter to export metrics as Prometheus format.
    exporter, err := prometheus.New(
        prometheus.WithoutCounterSuffixes(),
        prometheus.WithoutUnits(),
    )
    if err != nil {
        g.Log().Fatal(ctx, err)
    }

    // OpenTelemetry provider.
    provider := otelmetric.MustProvider(otelmetric.WithReader(exporter))
    provider.SetAsGlobal()
    defer provider.Shutdown(ctx)

    // Counter.
    counter.Inc(ctx)
    counter.Add(ctx, 10)

    // UpDownCounter.
    upDownCounter.Inc(ctx)
    upDownCounter.Add(ctx, 10)
    upDownCounter.Dec(ctx)

    // Record values for histogram.
    histogram.Record(1)
    histogram.Record(20)
    histogram.Record(30)
    histogram.Record(101)
    histogram.Record(2000)
    histogram.Record(9000)
    histogram.Record(20000)

    // HTTP Server for metrics exporting.
    otelmetric.StartPrometheusMetricsServer(8000, "/metrics")
}
Counter & UpDownCounter
Counter and UpDownCounter are relatively simple, so they won't be elaborated here. However, it is important to note that although Counter and UpDownCounter appear similar, they serve to more accurately and finely distinguish usage scenarios. Mapping these data types to classic Prometheus metric types, Counter corresponds to the Counter metric type of Prometheus, whereas UpDownCounter corresponds to the Gauge metric type of Prometheus.
Histogram
Histogram is a statistical type that allows for the quick computation of percentile statistics such as p95, p99, resulting in a histogram of metrics like time consumption and success/failure rates. Note that this metric uses considerable memory and space, so it's inadvisable to add too many dynamic attributes, as different attributes may derive different storage values for the same Histogram metric.
Prometheus Exporter
In this example, we have used the commonly used Prometheus protocol to output metric contents, typically to expose metrics for external components to capture. The metrics are exposed using the following route with the Prometheus protocol:
otelmetric.StartPrometheusMetricsServer(8000, "/metrics")
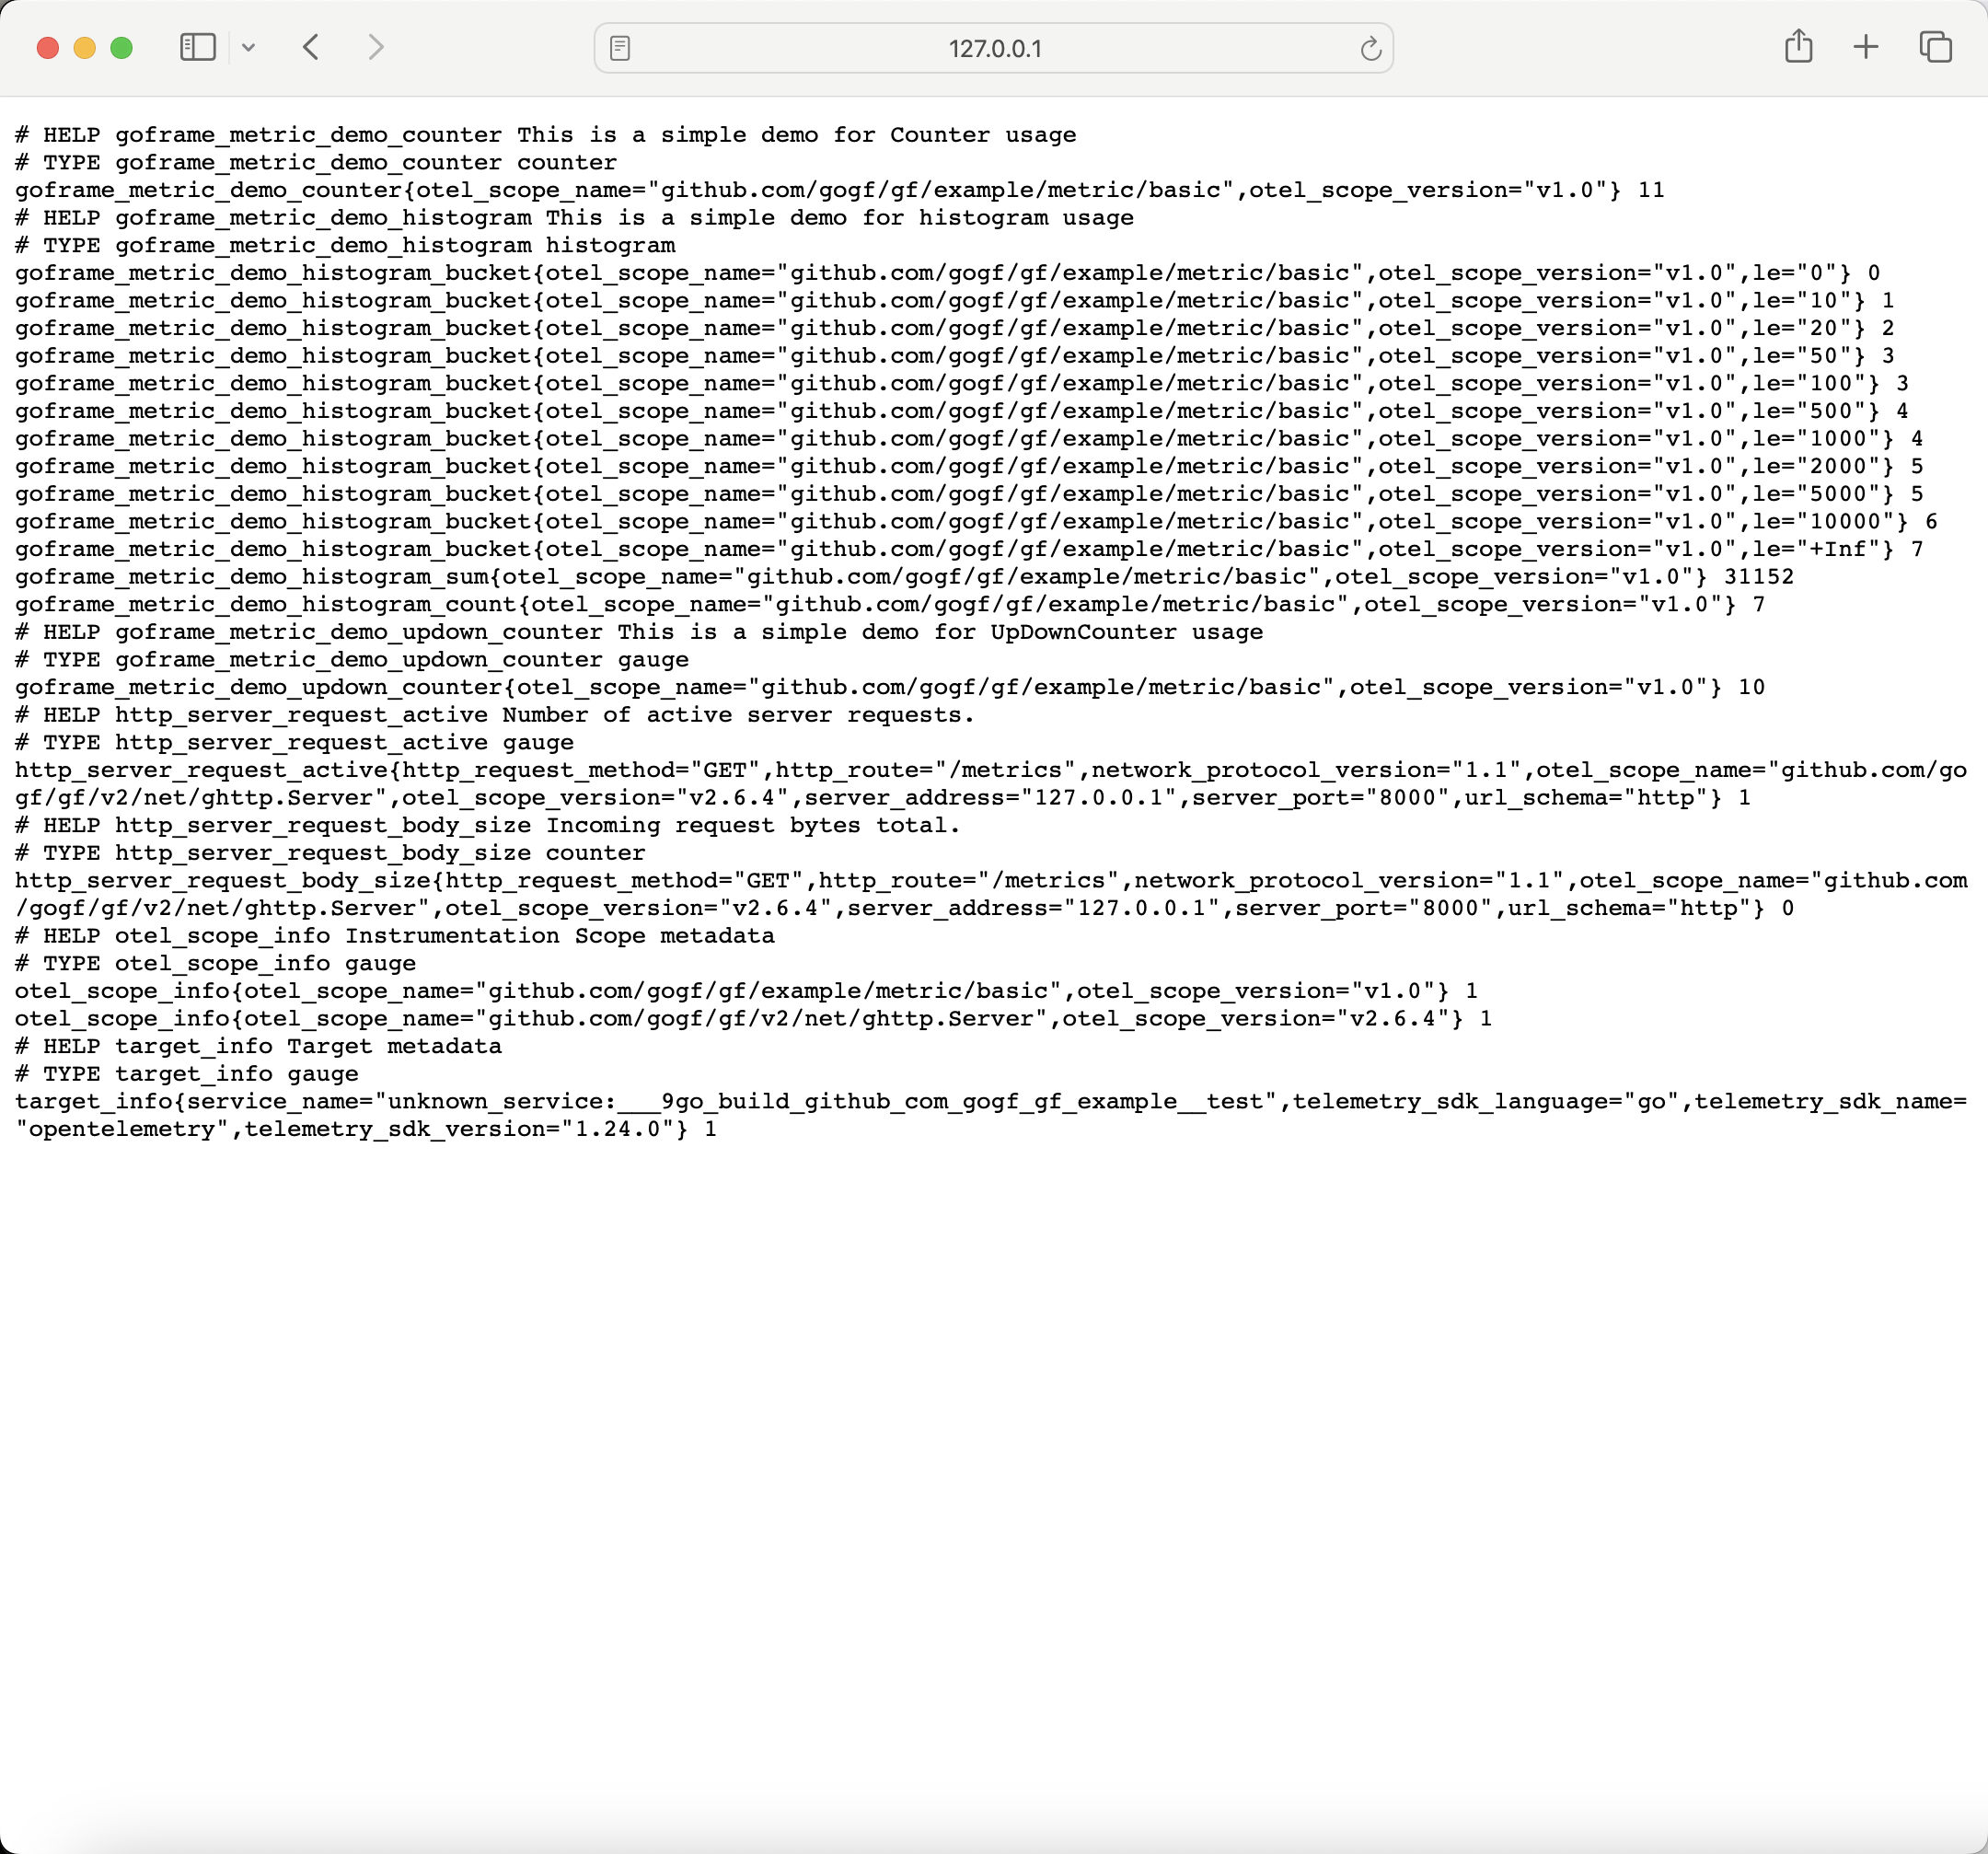
After execution, visit http://127.0.0.1:8000/metrics to view the exposed metrics:

We focus only on the metrics in this example, while other automatically exposed metrics will be introduced in subsequent sections.