Introduction
Asynchronous monitoring metrics execute the metric calculation logic only when metrics reader starts using that metric. Asynchronous metrics require a callback function, which is used to generate metric values and is triggered only when the metrics reader reads the metric. For example, metrics for machine CPU, memory, and disk usage, if not pulled or used by the target end, calculating metric values in advance is meaningless and wasteful of computational resources, making them suitable to manage as asynchronous metrics.
The asynchronous metrics provided by gmetric include: ObservableCounter, ObservableUpDownCounter, OvservableGauge. Asynchronous metric types are named starting with Observable, and operations for the three asynchronous metrics are quite similar, differing only in usage across different business scenarios.
Let's demonstrate the basic usage of asynchronous metrics with a simple example.
package main

import (
    "context"

    "go.opentelemetry.io/otel/exporters/prometheus"

    "github.com/gogf/gf/contrib/metric/otelmetric/v2"
    "github.com/gogf/gf/v2/frame/g"
    "github.com/gogf/gf/v2/os/gctx"
    "github.com/gogf/gf/v2/os/gmetric"
)

var (
    meter = gmetric.GetGlobalProvider().Meter(gmetric.MeterOption{
        Instrument:        "github.com/gogf/gf/example/metric/basic",
        InstrumentVersion: "v1.0",
    })
    observableCounter = meter.MustObservableCounter(
        "goframe.metric.demo.observable_counter",
        gmetric.MetricOption{
            Help: "This is a simple demo for ObservableCounter usage",
            Unit: "%",
        },
    )
    observableUpDownCounter = meter.MustObservableUpDownCounter(
        "goframe.metric.demo.observable_updown_counter",
        gmetric.MetricOption{
            Help: "This is a simple demo for ObservableUpDownCounter usage",
            Unit: "%",
        },
    )
    observableGauge = meter.MustObservableGauge(
        "goframe.metric.demo.observable_gauge",
        gmetric.MetricOption{
            Help: "This is a simple demo for ObservableGauge usage",
            Unit: "%",
        },
    )
)

func main() {
    var ctx = gctx.New()

    // Callback for observable metrics.
    meter.MustRegisterCallback(func(ctx context.Context, obs gmetric.Observer) error {
        obs.Observe(observableCounter, 10)
        obs.Observe(observableUpDownCounter, 20)
        obs.Observe(observableGauge, 30)
        return nil
    }, observableCounter, observableUpDownCounter, observableGauge)

    // Prometheus exporter to export metrics as Prometheus format.
    exporter, err := prometheus.New(
        prometheus.WithoutCounterSuffixes(),
        prometheus.WithoutUnits(),
    )
    if err != nil {
        g.Log().Fatal(ctx, err)
    }

    // OpenTelemetry provider.
    provider := otelmetric.MustProvider(otelmetric.WithReader(exporter))
    provider.SetAsGlobal()
    defer provider.Shutdown(ctx)

    // HTTP Server for metrics exporting.
    otelmetric.StartPrometheusMetricsServer(8000, "/metrics")
}
Meter Callback
Asynchronous metrics require the definition of a Callback function to manage metric value changes, and this Callback function will only execute upon request or use of the metric. The Observe function is used within the Callback function to update the metric's value, producing different results for different types of asynchronous metrics.
- For
ObservableCounter/ObservableUpDownCountermetric types, using theObservefunction will increment or decrement the existing metric value. - For
ObservableGaugemetric types, using theObservefunction will update the metric to the value given byObserve.
Metric Callback
In addition to updating the value of asynchronous metrics using Meter Callback, you can also specify the Callback function by using MetricOption when creating metrics. For example:
observableCounter = meter.MustObservableCounter(
    "goframe.metric.demo.observable_counter",
    gmetric.MetricOption{
        Help: "This is a simple demo for ObservableCounter usage",
        Unit: "%",
        Callback: func(ctx context.Context, obs gmetric.MetricObserver) error {
            obs.Observe(10)
            return nil
        },
    },
)
Prometheus Exporter
Expose metrics using the Prometheus protocol through the following route:
otelmetric.StartPrometheusMetricsServer(8000, "/metrics")
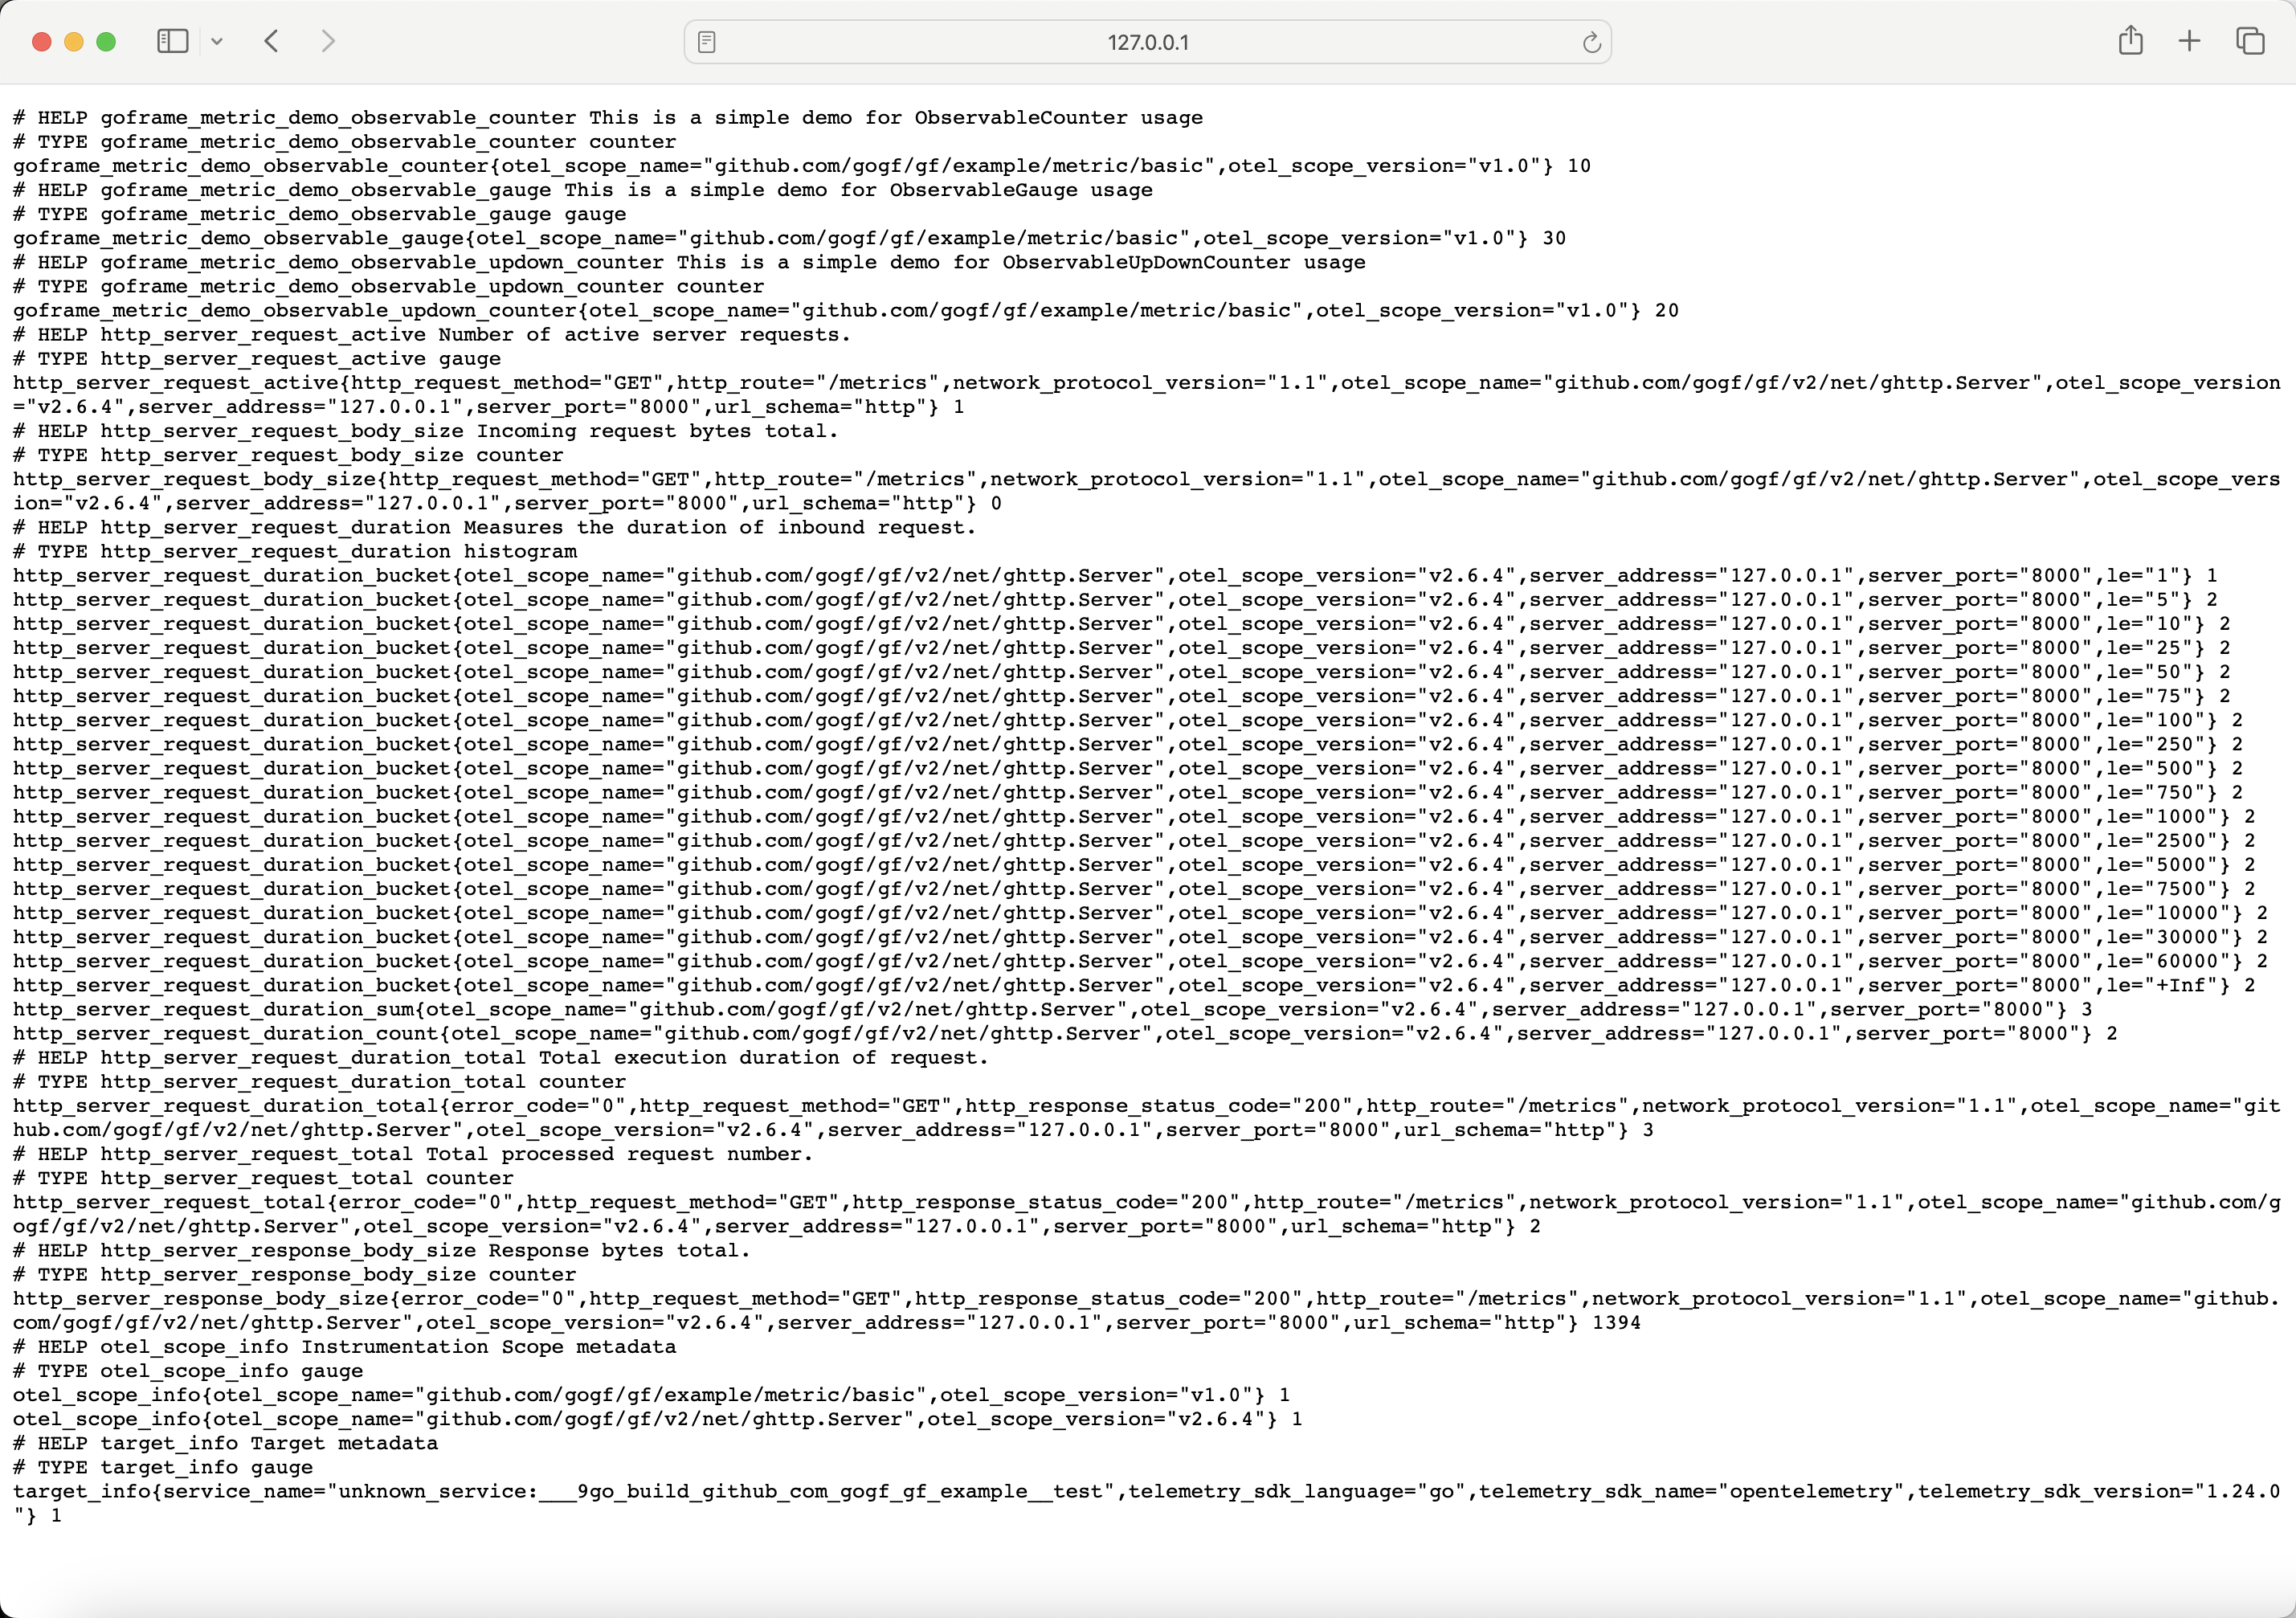
After execution, visit http://127.0.0.1:8000/metrics to view exposed metrics:

Here we only focus on the metrics from this example; other automatically exposed metrics will be introduced in subsequent sections.